Tutorial 3 of 7
Paths, velocity profiles and blending
Intermediate 12 min
Combine PTP, LIN and CIRC moves, choose trapezoidal, quintic or S-curve profiles, round corners with blend radii and read the plots.
Open the Arc-welding seam (6-axis) template.
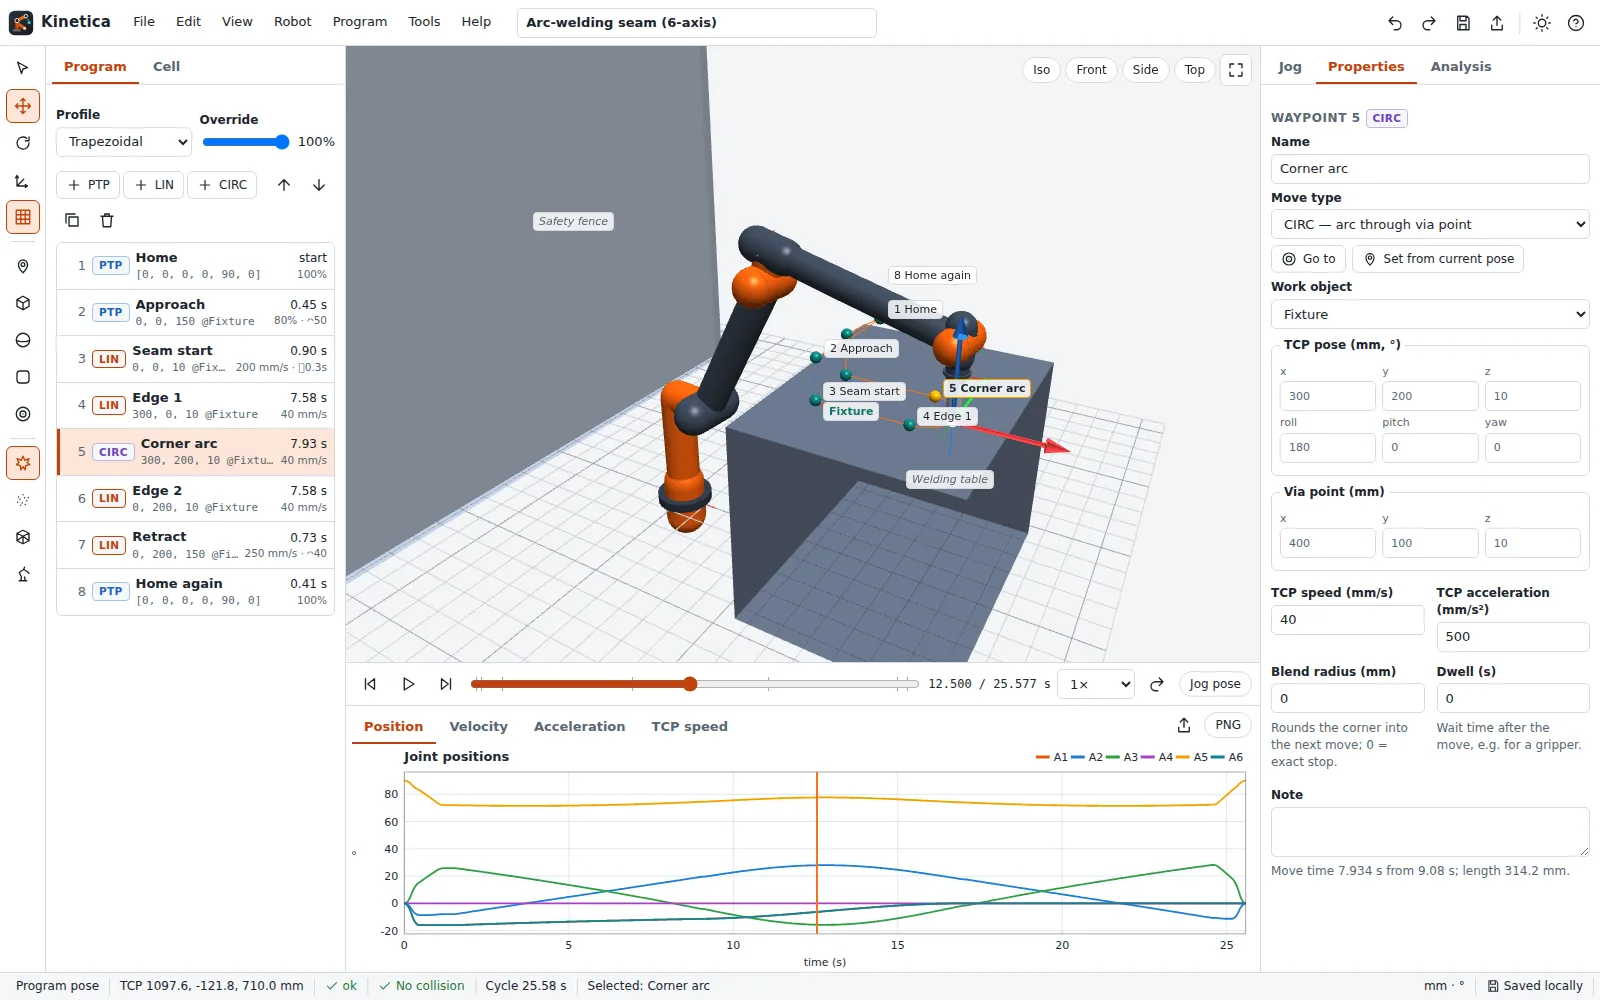
Move types
| Move | What the TCP does | Speed field |
|---|---|---|
| PTP | All joints move together from start to target; the TCP path is curved. | % of the joint speed limits |
| LIN | The TCP follows a straight line, the orientation is interpolated (slerp). | mm/s |
| CIRC | The TCP follows the circle through start, via point and end. | mm/s |
PTP moves are synchronous: one profile drives a path parameter, so every joint starts and stops at the same time and none exceeds its velocity, acceleration or jerk limit. LIN and CIRC moves solve IK at every sample; if a joint would exceed its limit, Kinetica slows that move down and shows the speed scale in Analysis → Segments.
Profiles
Choose the profile in the Program panel (or Program → Velocity profile):
- Trapezoidal — constant acceleration, cruise, constant deceleration. For a 90° joint move at 156°/s and 400°/s² the move takes 90/156 + 156/400 = 0.967 s.
- Quintic (minimum jerk) — smooth 5th-order polynomial; peak velocity 1.875·h/T.
- S-curve — jerk-limited double-S profile; the jerk limit is set per joint in the robot editor (default 10 × the acceleration limit).
Blending
Set a Blend radius on a waypoint to round the corner into the next move. The next move starts while the TCP is still inside the blend sphere, and both moves are superposed in joint space, so the robot does not stop. The overlap appears in the Segments table. A Dwell time (e.g. for a gripper) forces an exact stop.
Read the plots
The bottom panel shows Position, Velocity, Acceleration and TCP speed. Dashed red lines mark the lowest joint velocity limit. Click anywhere in a plot to jump the timeline there; export the plot as SVG or PNG with the buttons on the right.
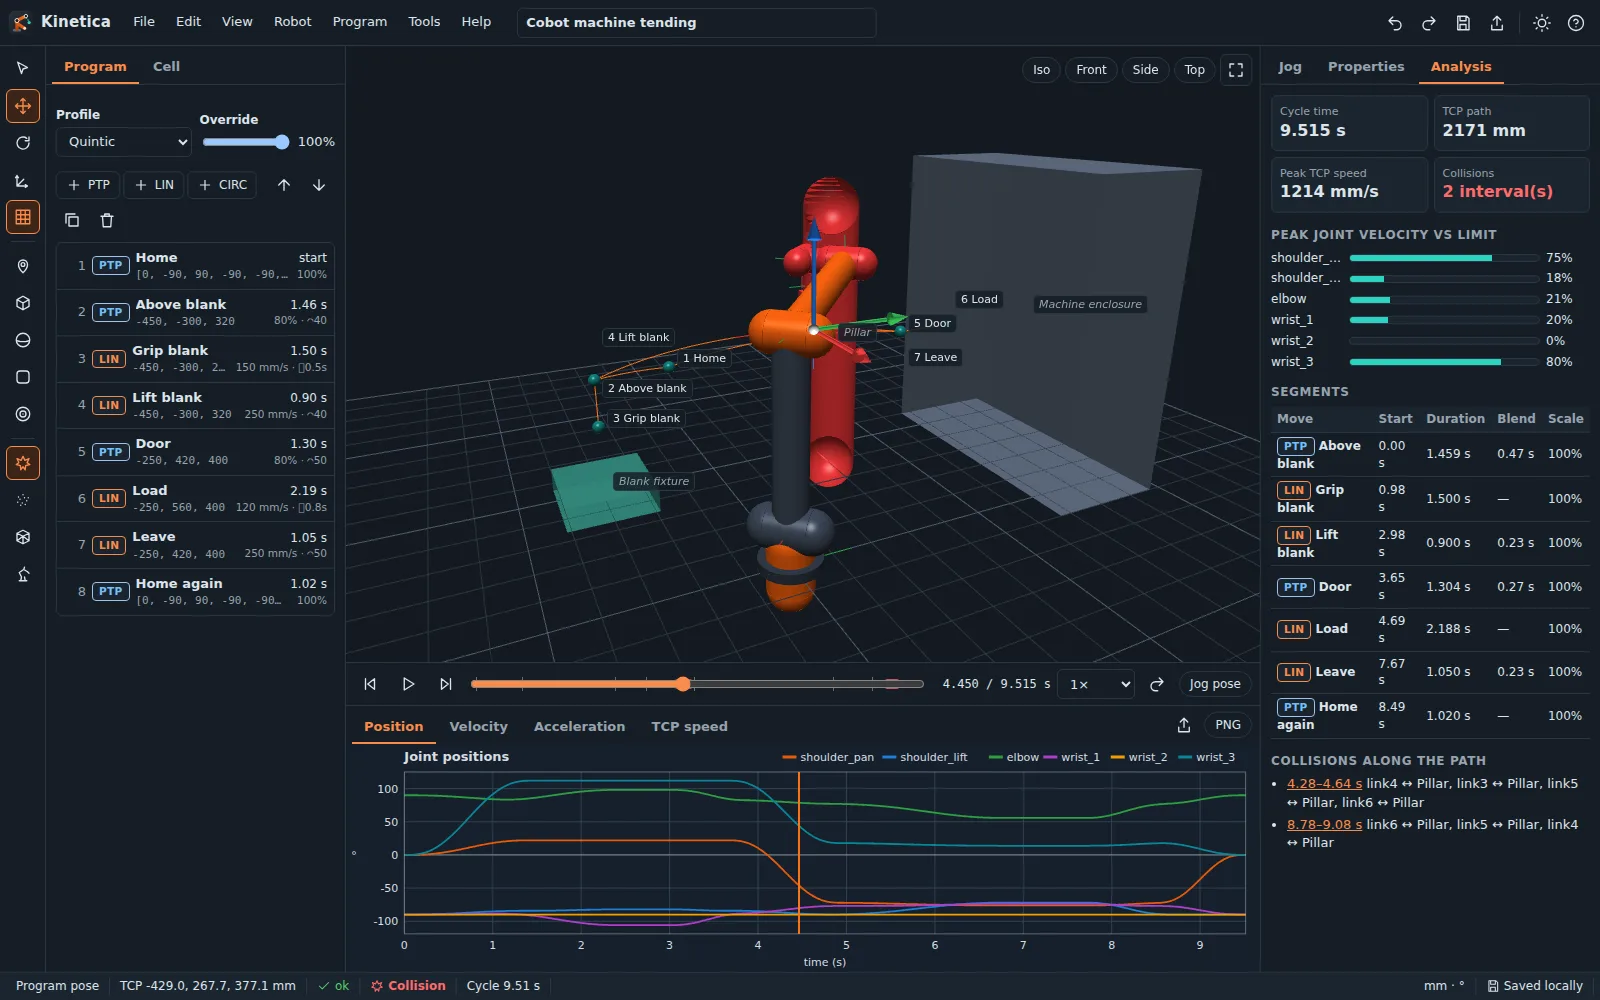
The Analysis tab lists the cycle time, TCP path length, peak TCP speed, the peak joint velocity of every joint as a share of its limit, all segments and any warnings.
Next: [Collision checking and cell layout](04-collision-checking-and-cell-layout).